
Data is no longer just boring numbers in spreadsheets – it is valuable information that can decide the success of your company. In the past, data analysis was the domain of large companies with their own experts. Today it is a necessity for companies of all sizes. If you don’t want to be left behind, you should know where this field is heading. In this article we introduce the most important trends in data analytics for 2025.
Summary for Those Who Don’t Have Time to Read the Whole Article
- Data will be available to all employees, not just specialists, which will speed up decision-making in companies.
- Artificial intelligence will simplify process automation, trend forecasting and a personal approach to customers.
- New approaches to privacy protection will replace outdated tracking with cookies.
- Instant, real-time data analysis will replace the old weekly or monthly reports.
- XAI (explainable artificial intelligence) will explain how it reached its conclusions, which is important especially in regulated industries (banking, healthcare). But it will find its place in e-shops too and help with managerial conclusions and recommendations.
1) Data Democratisation: Every Employee Is an Analyst
One of the most significant trends in data analytics is making data accessible to all employees. What does that mean? Simply put, working with data will no longer be only for the IT department or data specialists. In 2025 it will be common that every employee has access to data and simple tools for analysing it.
Imagine that as a marketer you create an overview of how your advertising campaigns are doing within a few minutes yourself. Or as a sales manager you see in real time how your team is performing. All without waiting for reports from the IT department or data specialists.
Why Is It So Important?
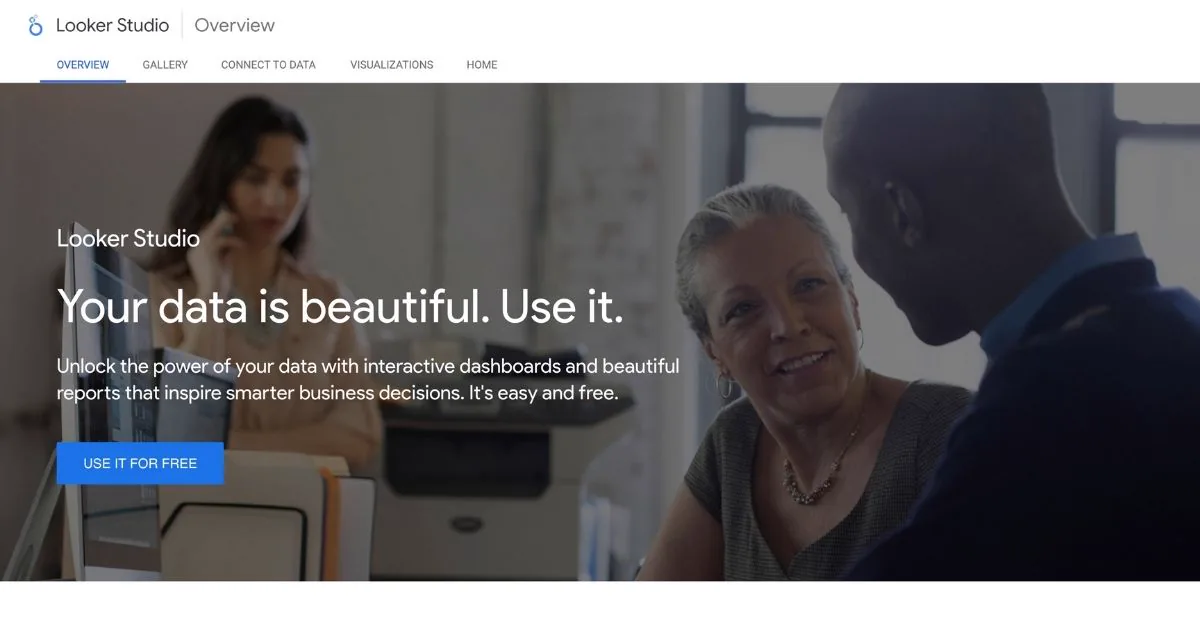
The main benefit is significantly faster decision-making. When employees have direct access to the figures, they can react to changes immediately. For example, simple reports in tools like Looker Studio let teams respond to changes almost instantly.
When data is available to everyone, it becomes a natural part of everyday decision-making at all levels of the company. Instead of relying on feelings or guesses, employees start to automatically look for answers in the data.
How to Start Using Data Across the Company?
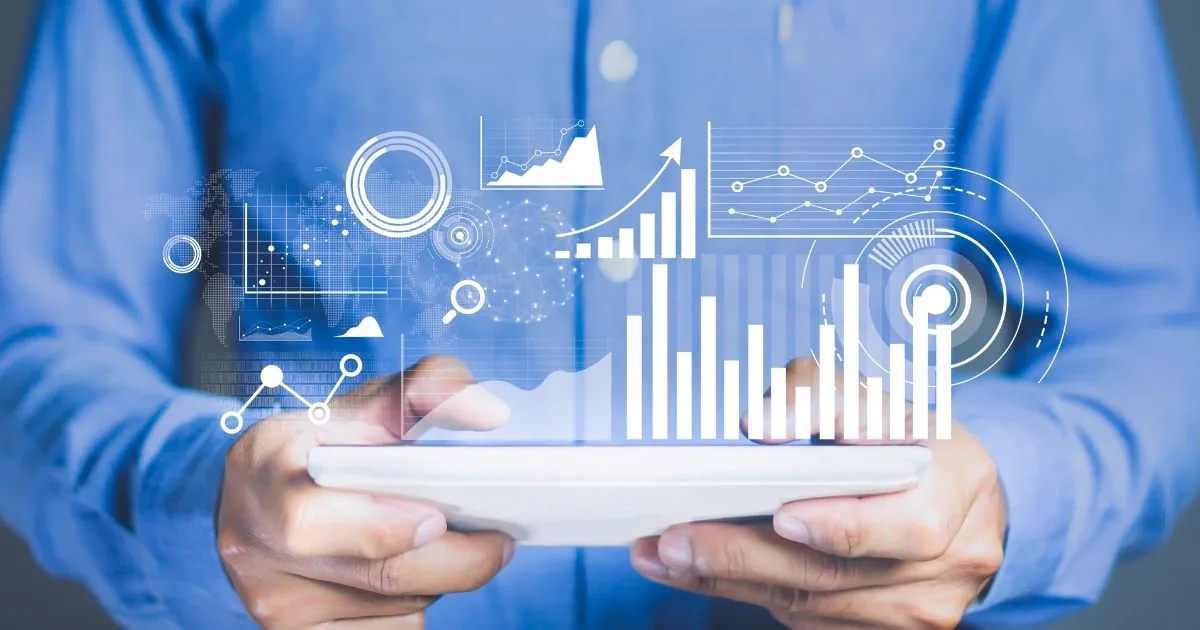
The key is to invest in simple tools for analysing and displaying data. These tools should be easy to understand and should not require technical knowledge. At the same time it is important to give employees basic training so that they understand what the data means and how to interpret it correctly.
How can we help you? We create clear and simple data reports in Looker Studio connected to other tools, so that your employees always have the information they need at hand. We will design a solution for you that does not require technical knowledge, and we will train your employees so that working with data is easy and natural for them.
2) Artificial Intelligence and Machine Learning: From Prediction to Automation
Artificial intelligence is nothing new in working with data. In 2025, however, it will be far more integrated into the everyday processes of companies of all sizes. What was once available only to technology giants can now be used by smaller companies too.
It is no longer just about predicting trends or analysing historical data. Artificial intelligence helps to automate entire processes, increase efficiency and create a personal approach to customers. Let’s look at the specific areas where it has the greatest impact.
Predictive Analytics: Fewer Assumptions, More Data-Backed Decisions
Predictive models use historical data to estimate future developments. In marketing they can, for example, determine which customers to approach and when, which significantly increases the success of campaigns.
Imagine you have an e-shop and want to offer a discount to customers who would otherwise not buy again. Normally you would send the discount to everyone. Using predictive and probabilistic models, however, you can send the offer only to those customers who are more likely to respond to it. The result can be up to a 25% increase in revenue from such campaigns.

Process Automation: From Manual Analysis to Smart Systems
Thanks to artificial intelligence it is possible to automate tasks that would otherwise take hours of manual work. These include, for example:
- Automatically segmenting customers by their behaviour on the website,
- detecting unusual changes in data (e.g. a sudden drop in sales),
- creating reports with specific recommendations.
These systems not only save time, but also make sure that no important piece of information in the data is overlooked.
For one of our clients we set up a system for automated detection of problems in online campaigns. If, for example, advertising costs rise but no new orders come in, the system informs them immediately and suggests what to change.
Personalising the Customer Journey: AI as a Creator of Experiences
Artificial intelligence makes it possible to tailor content to each customer based on their previous behaviour, preferences and current situation. The result is targeted content that appeals to the customer more and leads them to action.
On an e-shop, for example, artificial intelligence can be used to recommend products that customers with similar buying habits like. Studies show that personalisation can increase the conversion rate by up to 20%.

Campaign Optimisation: Better Results for Less Money
Artificial intelligence can analyse the success of advertising campaigns in real time and automatically suggest adjustments to budgets, targeting or ad messaging. That can not only increase effectiveness but also reduce the cost of acquiring a customer.
In Google Ads, for example, tools with artificial intelligence can recognise which person is likely to buy from you and which will just click and leave. Thanks to that you can direct your money at those who will really buy and save up to 15% of your monthly advertising budget.
The Manager’s Right Hand: Don’t Do the Donkey Work.
In analytics, too, you can use the assistant capabilities of individual models to communicate with artificial intelligence in natural language. For example, based on samples you can have it recommend an analysis that would be worth carrying out, identify simple patterns or get help summarising a complex table or report.
For example, prompts such as “summarise this document for a marketing manager who is interested in the benefits of the changes” are used almost every day today. Similarly, unstructured data such as texts and images can be evaluated to monitor competitors’ activities.
3) Privacy-First Analytics: The Future Without Cookies
People want more privacy and laws (such as the GDPR) give them the right to decide what websites may know about them.
In the past, companies could easily track what users do on the internet – which pages they visit, what they click on, what interests them. This was done with so-called third-party cookies – small files that websites pass to each other about users.
These tracking tools are gradually being phased out. Browsers such as Chrome, Safari or Firefox block them, and people often do not consent to them. For companies this means they lose visibility into:
- Where visitors to their website come from,
- what interests customers the most,
- which ads really work.
Companies that don’t adapt to this change won’t know whether their marketing works, and will waste money on ineffective ads. And in times when every crown counts, few can afford that.

How to Track Website Success While Respecting User Privacy?
Today there are three main ways to get valuable information about the visitors to your website while respecting their privacy.
- Moving measurement to your server – Instead of capturing information about the visitor directly in their browser, the data is processed on your server. This principle is used by advanced tools such as Google Tag Manager Server-Side. You get more accurate data and don’t depend on third-party cookies.
- Using your own domains for measurement – Common measurement tools often use domains that ad blockers and browsers may block automatically. The solution is to use your own domains.
- A better way of obtaining tracking consent – Many companies use consent systems that are confusing or unpleasant for users. They are often confusing even for the companies that implement them, more out of obligation than because they understand their meaning. A well-designed system can significantly increase the number of users who allow you to track their visit.
All of these solutions will help you get valuable information about your customers even at a time when privacy protection is increasingly important. Want help setting them up? Contact us. With Archetix you will be ready for a future in which respect for privacy and effective data analysis go hand in hand. In 2024 and 2025 these were, and still are, the projects we handle most often.
4) Real-Time Analysis: The End of Waiting for Reports
The era of weekly or monthly reports is definitively behind us. In 2025 companies will increasingly rely on real-time data analysis, which lets them react immediately to changes in customer behaviour or campaign performance.
What Does Real-Time Analytics Bring?
- An instant overview of campaign performance,
- a quick reaction to unexpected situations or opportunities,
- more efficient use of the budget thanks to the ability to redirect funds immediately to where they bring the best results.
How to Introduce Real-Time Analysis?
The essential thing is to use the BigQuery platform (and Firestore for richer data) in combination with tools for streaming data in real time. These technologies make it possible to process and analyse data practically immediately after it is created.
Real-time reports built in tools such as Looker Studio, which we use, then provide a clear visualisation of this data, which makes it possible to quickly identify problems or opportunities and react to them.
The way into this area is often opened for clients by a self-managed analytics server, and the first steps are offered above all around server-side measurement.
5) Clear Data Visualisation: Less Is More
In a flood of data it is ever harder to find what matters. That is why in 2025 even greater emphasis will be placed on effective data visualisation that lets non-technical teams quickly understand key information and trends. Current trends in data visualisation include:
- Simplicity – Overcrowded reports with dozens of charts and tables are giving way to a simple approach. The emphasis is on displaying only the most important indicators, which makes it easier to grasp the situation quickly.
- Storytelling – Data in itself has no value if it doesn’t tell a story. Modern data visualisation focuses on telling a story through data. It shows not only what is happening, but also why it is happening and what the next step should be.
- Interactivity – Static charts are being replaced by interactive visualisations that let users explore the data from different angles and look for answers to specific questions.
At Archetix we create clear dashboards that answer the questions: What is happening? Why is it happening? And what should we do next? Thanks to the connection with Google Sheets, Looker Studio and other tools you always have the data at your fingertips. AI can also help around visualisations, but the data always needs to be checked by a specialist.
6) Connecting Marketing and Data Analytics: Real Return on Investment
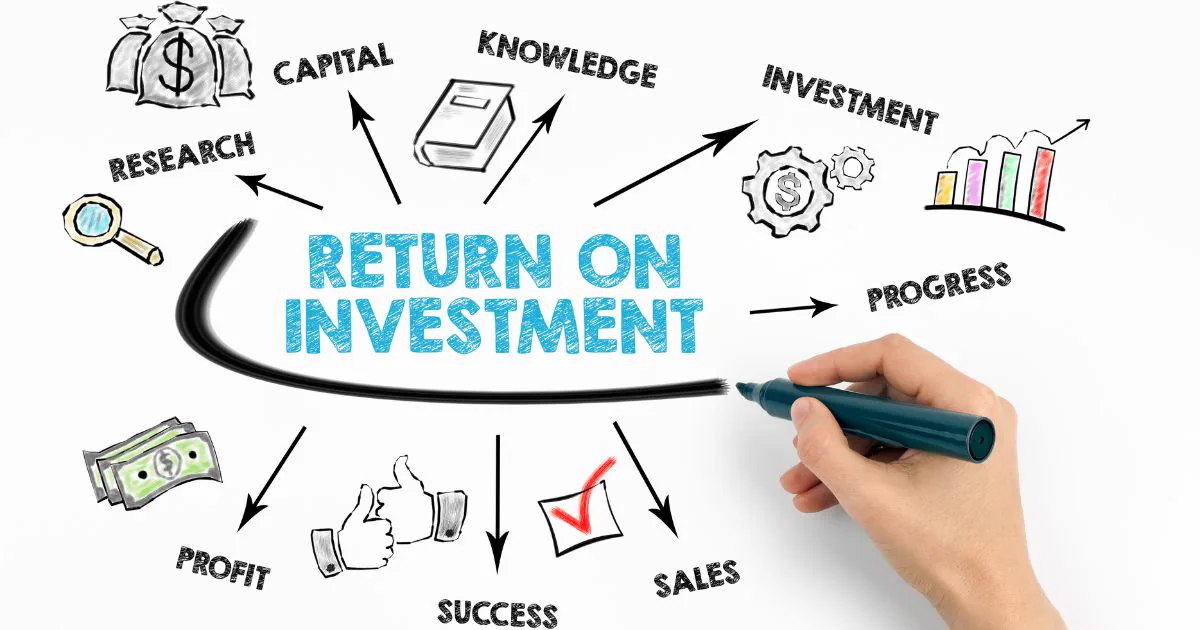
Return on marketing investment (ROMI) is becoming one of the most important indicators for evaluating marketing activities. In 2025 it will no longer be enough to track only click-through rate or the number of conversions. Companies will want to know what real financial benefit their marketing activities have.
Why Is Measuring Return on Investment So Important?
Companies invest considerable resources in marketing, but often have no clear idea of the real return on these investments. Measuring return provides a clear picture of which campaigns and channels bring real value.
How to Measure Return on Marketing Investment?
Connect marketing data with financial data. This requires cooperation between the marketing and finance departments and the implementation of tools that make it possible to track the entire customer journey from first contact to purchase and its value.
Thanks to our advanced reports in Looker Studio we can determine exactly which campaigns bring profit and where, on the contrary, money is being wasted.
In connection with ROMI, the topic of bidding on margin is also coming to the fore.
7) Explainable AI (XAI)
With the growing use of artificial intelligence in data analytics, the need grows to understand how artificial intelligence reaches its conclusions. Explainable AI (XAI) makes it possible to look into the “black box” of AI systems and understand their decision-making processes.
It is key especially in finance or healthcare, where it is essential to comply with strict regulatory requirements and build user trust.
Example: A bank uses a computer program (artificial intelligence) to decide who gets a loan and who doesn’t. When the program says, “This person will not get a loan,” the bank must be able to explain WHY. It can’t just tell the client: “The computer decided so and we don’t know why.”
Companies will increasingly use tools and techniques that increase the transparency of AI systems:
- LIME (Local Interpretable Model-agnostic Explanations) – A technique that helps explain why the AI made a specific decision.
- SHAP (SHapley Additive exPlanations) – A method that determines how significantly each input factor contributed to the final result.
- Counterfactual explanations – Explanations that show how the input would have to change in order to change the result.

At Archetix we regularly train assistants that help clients explain analytical data or the documentation of data processes. We often use Gemini as an AI assistant designed for companies, which solves a common problem of ChatGPT, namely that it doesn’t learn from your data. The Explainable AI concept is gradually becoming available in Google’s NotebookLM, where the model works only with the data you put into it during training and then works with that. This is very suitable, for example, for assistance explaining the documentation of certain data processes or implementations.
How to Prepare for the Future of Data Analytics?
Trends in data analytics are constantly evolving. How do you prepare for that?
Invest in Education
The key to success is to have a team that understands not only the current but also future trends in data analytics. Investment in training employees in data literacy, artificial intelligence and other relevant areas will pay off many times over.
Focus on Flexible Infrastructure
In technology everything changes very quickly. What is new and modern today may be outdated in a year. Use data systems that:
- You can easily modify when a new technology arrives.
- Can be scaled up when you have more data or customers.
- Can connect to new tools that you will need in the future.
Work with Experts
Finding, paying for and keeping a team of top data specialists is very expensive. For most companies it is an unnecessary luxury.
It is much more practical to work with external experts who:
- Already have experience from many different projects.
- Follow the latest trends in the field.
- Know how to apply modern data practices.
- Help you when you need them, and you don’t pay for them when you don’t.
Our goal is for our clients to be able to rely on data as a key source of their growth. Whether you need to introduce advanced measurement, optimise reports or understand how to turn data into results, we are here for you.
Frequently Asked Questions
What is data analytics?
Data analytics is the process of collecting, processing and evaluating data in order to obtain useful information. It helps companies make better decisions based on facts instead of guesses.
Why is data analytics important?
Because companies of all sizes need to react quickly to change. Properly used data lets them plan better, save costs and increase profits.
Who should have access to data in a company?
Everyone. In 2025 data is no longer just for IT or analysts – simple tools make it possible for marketers, salespeople and company management to work with data too.
How can artificial intelligence help with data?
AI can predict customer behaviour, automate routine tasks, detect problems before they occur and personalise communication with customers.
What does real-time analysis mean?
It means monitoring data and results instantly, without waiting for weekly or monthly reports. Thanks to that you can react right away to what is happening.
Will cookies still be used?
Third-party cookies are ending. Modern analytics focuses on privacy protection and uses new measurement methods that do not violate users’ rights.
What is explainable AI (XAI)?
XAI helps you understand how the AI arrived at its decision. It is key where you need transparency – for example in banks or healthcare.
How do I visualise data so that everyone understands it?
Simply. Less is more – use clear charts, clear indicators and a story that the data tells.
What is ROMI and why measure it?
ROMI (return on marketing investment) shows which campaigns really pay off. It helps you invest sensibly and not waste your budget.