

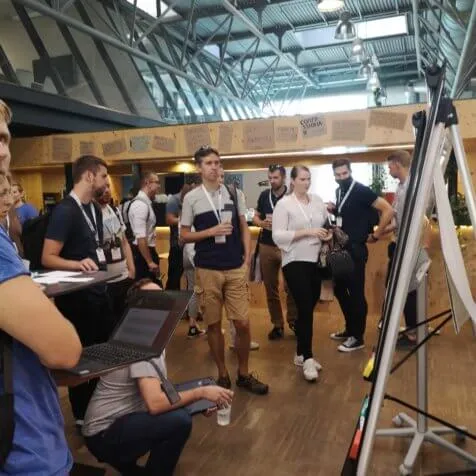
Education is a very important part of our industry, because new tools keep appearing and everything moves quickly. We at Archetix try to use all the opportunities that come our way. Given the current situation in the world, most events took place online, so when MeasureCamp Brno came up, we simply had to go! Why were we so looking forward to it, apart from the chance to meet others? The whole event keeps to the unconference format in the sense that the programme is created on the spot. This gives the event a wonderful atmosphere, as it is a mix of prepared talks and those that arise during the conference.
On Friday evening we met other MeasureCamp participants, where we discussed everything that has happened lately, what everyone has learned, what interests whom, and which topics could be discussed the next day.
The Analyst’s Compromises
The talk was designed rather for beginners. Hana Kalivodová summed up what was discussed in January at Superweek 2020. One of the big topics that divides people into two camps is personalisation and the ethics that follow from it – what should be personalised and when does it go too far. Next came the topic of basic measurement mistakes and other topics from practice, for example the eternal “fast and good, but free”. These three things usually do not work together, as the following page also shows.
Predictive Models in Unpredictable Times
A very interesting talk on how to adapt given the current situation around Covid-19, when there were big swings compared with past data, you cannot rely on time inertia, seasonal effects do not apply, and customer behaviour has often changed.
From Raw Data to User Journey
Antonín Kučera from Livesport showed the behind-the-scenes of their long-term analytics project, in which they built their own analytics platform. Livesport focuses on results and analyses of sports matches, which it communicates to its users. Their platform turns raw data into valuable data mapping user journeys and the behaviour of users on the site in connection with ongoing matches. The whole talk showed how key it is, in such an extensive analytics project, to map needs across the company, create key strategic documents and communicate everything thoroughly across the company.
Taming 100+ TB of Data from the Web+App Export to BigQuery
The presentation followed on from the previous talk by the people from Livesport. A nice talk on how they dealt with the data pipeline from web and app – a 12-month journey from the raw GA web+app export in BigQuery to an automated pipeline.
Help us improve our game analytics + marketing
A discussion about tracking apps and advertising inside your own apps. After a while the discussion turned to the problem of “black boxes” and the fact that we certainly cannot check a black box with another black box.
Automatic Implementation Checking
Our co-owner and product owner of implementation projects, Marek Čech, together with Honza Kadleček from Analytixer, presented an approach to validating the data layer using Google Apps Script. A simple method, in which the parts of the data layer that need checking are sent to a data warehouse and allow semi-automatic evaluation of a correctly set up data layer, interested the listeners so much that in the final rating it received the second-highest number of votes. The talk included a demo of an add-on for Google Sheets that speeds up the whole process even more.
How Browsers Can Break Data in GA
Tomáš Baxa showed us how tabs left open in the browser for a long time can corrupt data in Google Analytics and how this can be handled using tab discarding.
BigQuery ML use case
A very interesting presentation on using BigQuery machine learning. A quick reminder of what logistic and linear regression are and how they are used in practice. How a machine learning model is created in BigQuery, and how and why it is important to evaluate it. We take away an important point – these things do not have to be that complicated. On top of that we take away a demonstration of a real case.
Levels of marketing mix effectiveness
In a simple talk, Marek Kobulský showed us 5 levels of evaluating the impact of marketing. From where we started, believing tools like FB analytics when they credit themselves with all the conversions that touched FB, to calculating several attribution models, at the level of channels as well as at the level of products or brands.
When manual validation of DL is not enough
Jan Brzobohatý from Cross Masters showed the results of their internal development project, which focused on validating the implementation of the data layer. We, like all analysts, struggle with the never-ending problem of having to check manually the data layer that programmers implement on clients’ websites. It often contains semantic or syntax errors that even an experienced analyst has trouble spotting. At Cross Masters they took a close look at this problem and created a Google Chrome extension called WAAILA – not yet available – that solves it. The talk included a demo of using the extension. The extension uses JSON Schema to validate the data layer and always works for the specific page being browsed. By coincidence, we also worked on this problem with Honza Kadleček of analytixer.com, where we chose a slightly different approach. You can read about it in the first and second article on the Analytixer website (both in Czech).
How to attack a competitors web analytics
Jan Hornych from Cross Masters reflected on the problem of attacks on web analytics and related tools at companies that use automation rules, e.g. for setting prices (pricing), bids in advertising systems (bidding) or for recommending products (recommendation engines). The premise is simple: in web analytics it is very easy to carry out attacks that damage your data forever. If you have automation rules for advertising or other systems connected to this data, it can easily happen that when, for example, transactions are forged, your automation system pushes campaign budgets to the maximum and exhausts your daily budget on non-existent conversions. As you can imagine, the consequences can be far-reaching and fixes impossible. Since Cross Masters works mainly with large clients, these attacks are becoming more and more common, and so they created the WAAILA platform for monitoring and preventing them. The talk included a demo of the newly emerging platform.
From Data to Revenue in eCommerce
Daniar Rusnak from the newly founded Slovak agency DataCop presented interesting case studies from the field of data analytics. The first concerned choosing the right moment to send automated and personalised emails. The second concerned choosing the right products for the most prominent campaigns. I very much appreciate their business approach to the whole issue and the good execution of the case studies.
How referrer policy affects acquisition reports
Marcus Stade from Munich showed the real impact of the change of referrer policy in the Chrome browser, which across the board switches all hyperlink clicks to “strict-origin-when-cross-origin”, which means that in analytics tools, for referral traffic you will see only the domain the user came from, and sometimes not even that.
For example, the most widespread blogging platform, WordPress, automatically puts “noopener noreferrer” into all links, so on a click you do not get even the information about the domain the link came from. You need to prepare for a larger share of direct traffic and check the key links that bring you traffic. For this you can use SEO tools such as Marketing Miner or Collabim, and for checking on the page, Marcus’s own tool, the Referrer Policy Checker.
Mistakes To Avoid in Data Interpretation
Hana Kalivodová, as is traditional, presented expert names for common phenomena that every analyst meets. She spoke about the problem of “chart myopia”, where with inappropriate zooming of a chart or too low a data granularity we can misinterpret non-existent trends. She named the already traditional problem of averages, which without suitable segmentation have zero explanatory value. She presented the often overlooked Anscombe’s quartet, a demonstration that 4 different datasets can have exactly the same statistical parameters but look completely different when plotted. The key takeaway for us is above all the importance of segmentation, which matters not only for targeting campaigns but above all for analysing data.
Does TopList Measure Better Than Seznam Analytics?
In a humorous talk reminiscing about the beginnings of measuring websites on the Czech internet, our Marek Čech recalled his own beginnings with websites and the internet, together with other participants of the discussion, which included big experts such as André Heller, Marek Lecián and the SEO pro Martin Žatkovič. Marek recalled the tools he met around 2005, when the top tools for measuring traffic included TopList and navrcholu. No website at the time could do without a guest book from BlueBoard, and swapping 88×31 pixel icons with sites from the field was a necessity. The daily bread of every webmaster was registering in directories and deleting spam from the above-mentioned guest book.
We also reminisced about the AwStats tool, that is, web analytics calculated from server logs, or the Piwik tool (today Matomo). In 2005 the waters of web analytics were stirred by Google’s purchase of Urchin and the birth of Google Analytics. Urchin then got two more major versions, in which Google AdWords was first introduced in 2008 and event measurement in 2010. From then on, analytics libraries were created under the Google Analytics banner.
At the end Marek showed a comparison of data from TopList, Google Analytics and Yandex.Metrica, which they monitor over the long term. In a hands-on demo during the talk we found that TopList contains something unheard of for its time, namely predictive analytics, or the option to set the initial value of the visit counter. With navrcholu we were interested to see that it still provides data on Service Provider, which you no longer find in Google Analytics.
Although it was a smaller conference than usual – there were 80 participants – there were plenty of interesting talks and overall we rate it top marks! We hope the current situation will allow us to head to one of the next MeasureCamps.