

Are you wondering how to better visualise and analyse the data from your website or e-shop? Do you need to monitor the performance of online marketing campaigns regularly, but have neither the time nor the expertise to set up complicated analytics tools? Looker Studio (formerly Google Data Studio) is the solution you are looking for.
This sophisticated visualisation tool offers a way to turn your data into interactive dashboards and reports that help you make informed decisions – if you know how.
In this article you will learn what Looker Studio is, how it works and why you should implement it. You will find out how this tool can turn your Google Analytics 4 data into easily understandable visual overviews and how to get custom reports exactly according to the needs of your business.
Quick Summary of the Most Important Things
- Looker Studio (formerly Google Data Studio) helps you create clear visual reports from your marketing data, website traffic or sales results that show, understandably and in real time, how your company is doing.
- You can connect Google services (GA4, Google Ads) to it, but other data sources too.
- We will be happy to prepare custom reports tailored to your needs, including advanced features such as BounceRateCheck.
- We can also handle complex integration of data from multiple sources and prepare overviews according to your company’s needs.
Looker Studio – What It Is and What It Is For
Looker Studio (formerly known as Google Data Studio) is a visualisation tool that is part of the ecosystem of Google products. But what exactly is Looker Studio? It is an advanced platform that lets you turn your data into understandable reports, where you can see at a glance how, for example, your SEO or PPC ads are doing.
More or less anything can be visualised – all you need is quality input data and a use for it. There is no point in visualising something you cannot work with further in your business. Besides Google services, you can connect Facebook, Sklik or, for example, Marketing Miner via a connector. It is worth remembering that some connectors are paid, for example the connection to Meta (Facebook, IG). Data can also be pulled into BigQuery and then into Looker.
This tool is primarily intended for visualising data from various sources, and its main strength is the ability to display data in real time. That means that as soon as you open a correctly configured Looker Studio report, you see the most up-to-date data available.
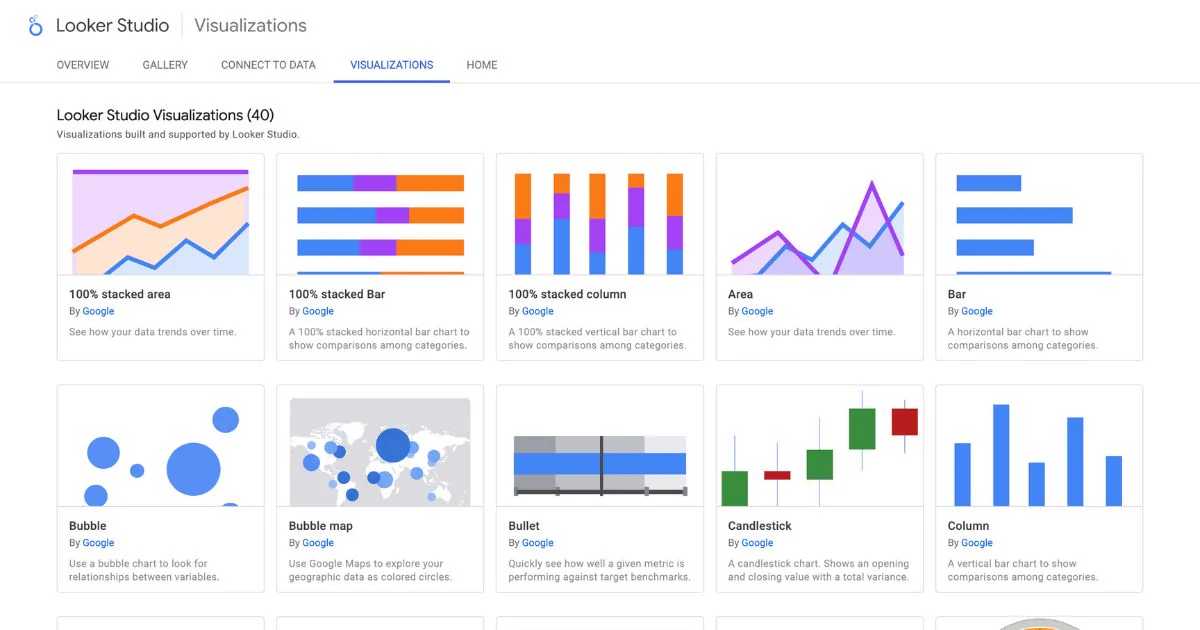
How Looker Studio Works in Practice
How does Looker Studio actually work from a technical point of view? It is a web application that you connect to through an ordinary internet browser. You don’t have to install anything, but to make full use of it you need to understand data and visualisations well.
First you have to connect Looker Studio with your data. The data most often connected comes from:
- Google Analytics 4
- Google Ads
- YouTube Analytics
- Google Sheets
- BigQuery
Once you have the data connected, you can start creating various charts, tables and other visual elements. If you know how, you can visualise absolutely anything.
At Archetix we create more complex visualisations than just basic charts – from overviews showing the fulfilment of key indicators to special solutions such as “Bounceratecheck”.
Bounceratecheck is our special feature that shows a table of campaigns and calculates the average bounce rate by traffic source.
The interactivity of reports is also important. Well-built reports contain filters that let users adjust the displayed data to their needs. Setting these filters up so that they are really useful is a bit harder, and that is exactly what we often help clients with.
How to Create Custom GA4 Reports with Looker Studio
When creating reports from GA4, it is important to understand how data is organised in Google Analytics 4. This structure has changed a lot compared with the older Universal Analytics.
GA4 works mainly with events and their parameters. That means that instead of tracking pages and their views (as before), GA4 now records various user actions as events. These events can be tracked automatically (for example clicks, page loads) or be custom events that you set up yourself.
Thanks to this event-based approach GA4 is much more adaptable – you can track practically any interaction of a user with your website or app. But this flexibility also means that you have to completely change the way you think about data and analyse it.
Instead of the traditional views of pages and conversions, you now have to learn to work with a stream of events and their parameters in order to get the same or even better information about the behaviour of your users. If you are getting lost in it, contact us, we will be happy to help. It is true that since the arrival of GA4 more and more marketing specialists and companies have been turning to us.
GA4 reports for traffic analysis are the cornerstone of most dashboards. Professionally built reports monitor:
- A comprehensive view of the number of visitors and their visits, with the option to split them into different target groups
- A detailed overview of where people come to your website from and how good those visits are.
- Improved tracking of what exactly people do on your website and how they interact with it.
- Precise measurement of important actions on the website (purchases, registrations) and finding out which channels contribute to them the most.
“Because we prepare all the reports to the client’s needs, it is a lot about agreement. In Data Studio (Looker) we dealt, for example, with visualising a funnel from events (GA4 can do that now, but classic Universal Analytics has no such option). The second specific solution was connecting and comparing data from the e-shop backend (conversions recorded in the administration) with the data in Google Analytics 4. Here we joined the transaction IDs and tracked the performance of sources (mainly PPC campaigns) in more detail,” says Tomáš Ondříšek.
For more complex analyses it is crucial to be able to create custom metrics, which requires a good understanding of the functions and calculations in the tool. It is not just about using preset values, but about building your own formulas according to your company’s needs.
Preset Report Templates in Looker Studio
Data Studio (now Looker Studio) is not the most advanced tool in terms of interactivity, but it is practical and clear, which makes it possible to create reports and visualisations that are pleasant and understandable for users.
There is a large number of ready-made templates for this tool – some free, others paid. Paid templates are usually designed so that you only need to replace the data source with your own data and everything works correctly. For most growing companies, however, they are not sufficient, because every company has its own specifics.
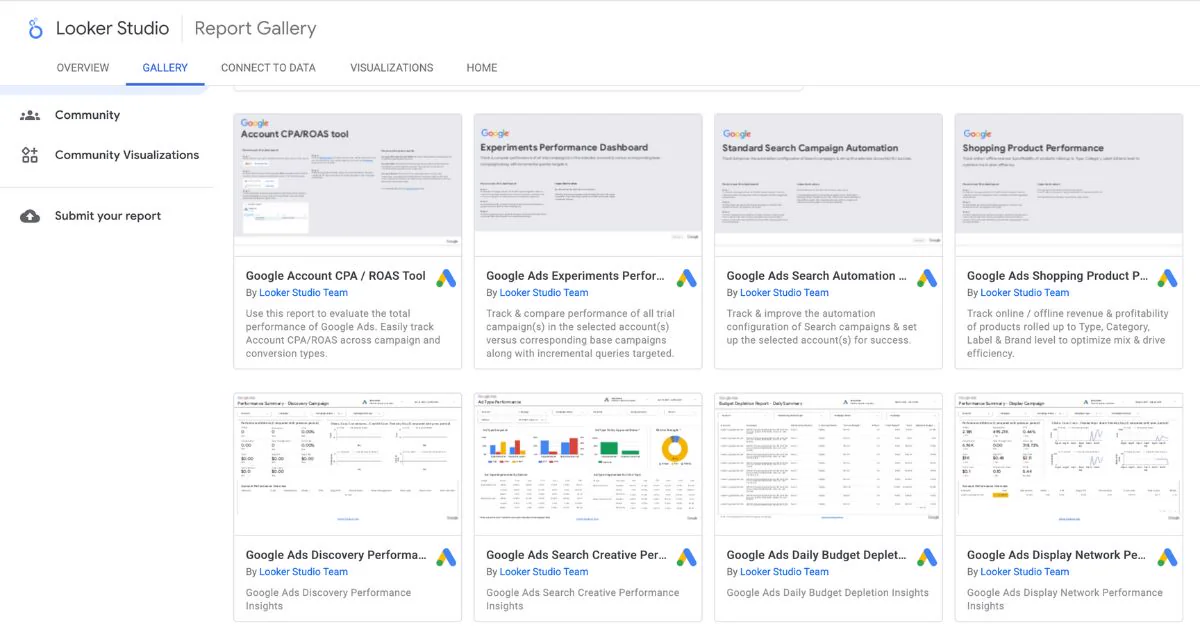
That is why we don’t use templates at Archetix. Instead we create solutions exactly to clients’ requirements – whether it is processing data from various sources or adapting to company processes.
Our speciality is thorough documentation. To every report we attach links to documents where clients find a detailed explanation of all calculations and metrics used, as well as further links to related reports, tables or tasks in internal systems. This way users always have the information they need to interpret the data correctly.
Connecting Data Sources in Looker Studio
One of the biggest advantages of Looker Studio is the ability to combine different data sources in one clear report. How does Looker Studio work with different data sources?
When Looker Studio joins different data, it first has to recognise which pieces of data belong together across different systems. It is like putting together a puzzle from different boxes – you have to find the right connecting points so that the resulting picture makes sense. Correct connection requires understanding the structure of each data source and the ability to identify common elements that can be used as “bridges” between them.
Which Data Sources Can Be Connected to Looker Studio
Looker Studio offers many ready-made connectors that make it possible to connect to various data sources:
- Google services:
- Google Analytics 4
- Google Ads
- Search Console
- YouTube Analytics
- Google Sheets
- Other marketing platforms:
- Facebook (paid connector)
- Instagram (paid connector)
- Seznam Sklik
- Databases and spreadsheets:
- BigQuery
- MySQL
- PostgreSQL
- CSV files
- Specialised tools:
- Marketing Miner
- Ahrefs
- Semrush (via third-party connectors)
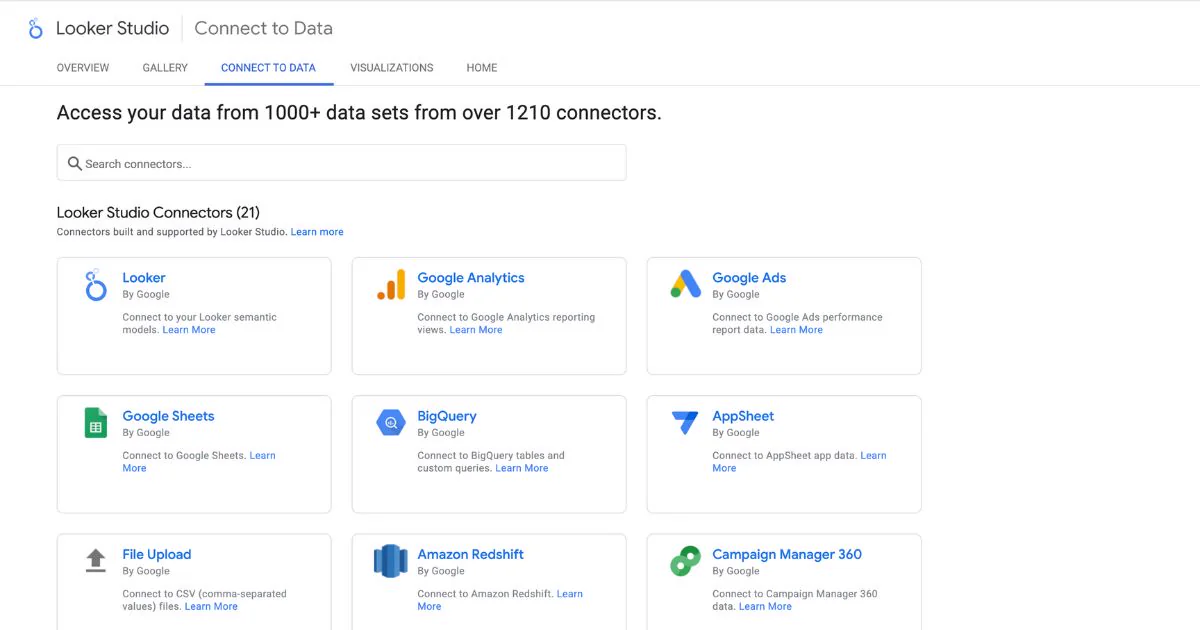
It should be mentioned that some connectors are not free – for example the connection to Meta (Facebook, IG). When you need to display and analyse data from these paid sources regularly, you have to count on certain additional financial costs.
Practical Examples of Connecting Data
Imagine you need to track the effectiveness of your marketing strategy across different channels. With the help of our experts you can get a dashboard that cleverly combines:
- Traffic from Google Analytics 4
- Advertising costs from Google Ads
- Conversions and their value from your e-shop
- Campaign budgets from a Google Sheets spreadsheet
Such an overview lets you see not only how many visitors come from the individual channels, but also what the cost of acquiring them is and what value they bring.
Another example is analysing content performance. Our specialists can connect:
- Comprehensive page traffic data from GA4
- Detailed keyword positions from Search Console
- Backlinks from external tools
- Content publishing information from your CMS
This type of report helps you find out which content is the most valuable for you and why. Thanks to it you see which articles, videos or posts attract the most attention, generate the most conversions or keep visitors on the website the longest.
Advanced Features of Looker Studio
To really use the potential of Looker Studio, it is necessary to get to know its advanced features, which requires a considerable investment of time on your part or cooperation with experts. What is Looker Studio in terms of advanced options? It is a tool that goes beyond mere visualisation and makes it possible to work with data at a deeper level – if you know how.
Data Transformation and Custom Metrics
Looker Studio makes it possible to create custom fields and metrics using complex formulas:
- Implement complex calculations of averages, weighted averages and percentages
- Set up conditional expressions (IF-THEN-ELSE) for advanced segmentation
- Work efficiently with regular expressions for sophisticated manipulation of text data
- Expertly combine metrics from different data sources for complex analyses
This functionality is extremely useful, for example, when creating complex KPIs that are not directly available in the original data.
Using BigQuery for Faster Processing
A problem that many users of Looker Studio run into is its speed when working with large amounts of data. As a rule, a direct connection to Analytics works well rather for small or medium-sized companies. When you have roughly 500,000 users a month, the tool slows down noticeably. In such cases a connection with BigQuery is needed.
How does Looker Studio work with BigQuery? BigQuery serves as a powerful database that can process huge amounts of data quickly, but its correct implementation requires advanced technical knowledge.
The process our specialists carry out usually looks like this:
- Expert export of data from GA4 or other sources to BigQuery
- Advanced preparation and optimisation of data in BigQuery
- Connecting Looker Studio to BigQuery instead of connecting directly to the original data sources
The result is significantly faster loading of reports, which is critical especially for large e-commerce projects or high-traffic websites. In our experience this approach is essential especially for websites with more than 500,000 visitors a month, when a direct connection to GA4 starts to become inefficient.
Interactivity and Filters
Interactive elements make Looker Studio a really useful tool for data analysis, provided you have them set up correctly. What does that actually mean:
- Advanced time filters – let you easily switch between different time periods (e.g. last week, last month, a custom period) and immediately see how your results change over time.
- Complex filters for splitting data – help you split information by different properties, such as device type, age group or geographical area.
- Drop-down menus for different metrics – let you quickly switch between different indicators (e.g. visits, conversions, revenue) without having to create new reports.
- Controls for changing the view – make it possible to change how the data is displayed and organised, so that you see the information from different angles.
Thanks to these interactive features, clients can explore the data themselves and look for answers to specific questions.
Practical Examples of Using Looker Studio
To better understand the potential of this tool, let’s look at specific examples of use that we most often carry out for clients.
E-commerce Reports
For e-shops, a well-configured Looker Studio is an excellent tool for tracking business results. With its help you can create overviews focused on:
- Analysis of revenue by category – you see which kinds of products bring you the most money and how the behaviour of different customer groups differs when buying them.
- Overview of shopping baskets – you find out which products customers most often buy together, how the average order value changes over the year and which seasonal fluctuations affect your sales.
- Measuring marketing success – you learn which advertising campaigns really bring a profit and which just spend your money without corresponding results.
- Mapping the customer journey – you uncover where customers most often leave your website before completing a purchase and what stops them.
These advanced overviews will help you discover your most successful products, find out which marketing channels bring you the best customers, and reveal problems that stop customers from completing a purchase.
Reports for Traffic Analysis
GA4 reports for traffic analysis help you understand how people behave on your website:
- Traffic trends – They show how the number of visitors changes over time and what the differences are between different groups of users.
- Where people come from – You find out whether they found you via Google, social networks or typed your address directly, and which of these sources bring the best visitors.
- Most popular pages – You see which parts of the website people are most interested in and how much time they spend on them.
- User paths – You track how visitors move around your website and which way they most often go.
This information is essential for improving the website and marketing campaigns, but setting it up correctly and understanding it is not simple.
Looker Studio for SEO Reports
Not sure whether an investment in SEO pays off for you? That is exactly why SEO reports are among the most in demand. Professional SEO reports in Looker Studio show you:
- Conversions from the traffic brought in – you really see whether and how many conversions the organic traffic brings you and how that changes over time.
- Development of organic traffic – tracking whether traffic from search engines is growing or falling.
- Performance of searched phrases – an overview of how you stand in search for the most important phrases.
- Top-performing pages – a view of which pages attract the most visitors from search engines.
Looker Studio for SEO reports is among the most popular. And for several reasons – you don’t have to go into several tools to find out whether your SEO works. You see everything in one place.
PPC Reports in Looker Studio
PPC reports are among the most important, because in one place you can see:
- A detailed overview of spend and results – a clear view of costs and revenues.
- Measuring return on money – tracking how much money each crown invested in advertising has brought you.
- Comparing different advertising systems – a unified view of how your ads are doing on Google, Seznam or social networks.
These reports make it possible to optimise the budget and focus on the most effective campaigns and keywords in a way that would not be possible without expert implementation.
Limitations and Disadvantages of Looker Studio
Although Looker Studio is a powerful tool, it has its limits. It is important to know these limits so that you can judge correctly whether it suits your needs, or when it is better to entrust its setup to experienced hands.
Performance Problems
The main obstacles arise when working with large amounts of data:
- When you connect Looker Studio directly to GA4 and have too much data, it can be extremely slow.
- Complex calculations and data adjustments can turn the loading of reports into waiting for Godot.
- When you cram too many charts and tables onto one page, the system starts to slow down significantly.
Fortunately we can solve this too – either by connecting through BigQuery (as we already mentioned), or by sensibly splitting large dashboards into several smaller, more digestible reports.
Limited Options for Working with Source Data
We see another weakness in working with raw data:
- There is no option to look under the bonnet and see the raw data in table form
- With more complex databases there is a problem with data hidden inside other data.
We can handle this limitation too. We can prepare the data in other tools such as BigQuery or Google Sheets.
Limitations of the Free Version
Although the basic version of Looker Studio is free, you have to count on having to pay for some things, because:
- Many basic connectors are paid (e.g. Facebook, LinkedIn)
- Advanced management and team collaboration features are available only in the paid version
- When using BigQuery you have to count on data processing costs.
Looker Studio Training and Expert Support
There are countless videos and publicly available courses for deepening your knowledge of Google Data Studio (Looker Studio). From time to time we also announce training courses or deliver tailor-made training – for example in companies. You can see the training we offer on our website.
We dare to say that there is nothing in Google Data Studio (Looker) that would surprise us. We don’t use everything on a daily basis, but we can set up even the nearly impossible. So don’t hesitate to contact us, we will be happy to help!
Frequently Asked Questions
What is the difference between Google Data Studio and Looker Studio?
It is the same tool, which was renamed from Google Data Studio to Looker Studio in 2022. The name change came after Google acquired Looker, a company specialising in business intelligence. The functionality stayed the same and is gradually being extended with new options. Our specialists follow all the updates and implement the latest features.
Can I visualise data from my own systems in Looker Studio?
Yes, but it is a technically more demanding process. There are several ways to achieve it, contact us and we will be happy to help you with it.
How often is data in Looker Studio reports updated?
The update frequency depends on the data source and the way it is implemented. With an expert connection to Google Analytics 4 or Google Ads, the data is updated automatically every time the report is loaded. For more complex implementations, especially those using BigQuery, an optimal update frequency can be set that ensures both up-to-date data and efficient use of resources.