

“Because of the large number of competitors, with potential customers comparing several websites, up to 88% of users do not return to a website after a bad UX experience – investing in understanding visitor behaviour is therefore critical” – source
In today’s digital age, understanding how visitors move around your website is absolutely essential. While tools such as Google Analytics 4 (GA4) provide comprehensive quantitative data, Microsoft Clarity offers an intuitive and visual view of user behaviour on your website. And the best part? This powerful tool is completely free and yet delivers the same value as paid tools. Clarity focuses on why users behave the way they do, without any complicated setup. It is a great complement that helps you get a complete picture of your website’s performance.
Clarity as a Complement to Your Existing Analytics
While GA4 is event-oriented and provides a broad overview of metrics and dimensions, Clarity complements this picture with qualitative data. Thanks to recordings and heatmaps, you can see where visitors click, where they should click but don’t, where they spend a lot of time and where little, where they leave the page, and other important information. This data is invaluable not only for marketers, but also for developers, who can use it to identify technical problems, UX obstacles or unintuitive elements on the website that regular testing does not reveal. It also saves you time on testing. By watching where users struggle, developers can improve UX in a targeted way and remove pain points.
Recordings and Heatmaps: See Where Things Get Stuck
Clarity gives you a unique view of your website through recordings and heatmaps. You don’t have to rely on tables and charts to understand where visitors get lost or what they click on. You can see exactly how they move around the page, where they spend the most time and where they get stuck. Websites with poor UX can lose up to 35% of sales – source
An AI Assistant That Saves Your Time
One of the biggest benefits of Clarity compared to other tools is the AI assistant. It becomes your personal analyst that can iterate over already filtered data and give you key insights. Instead of going through hundreds of recordings and heatmaps to find a problem, the AI assistant does it for you. It saves you a lot of time and lets you focus on implementing changes that really move your website forward.
If you are looking for a simple, visually rich tool for analysing user behaviour that also saves you time and helps uncover technical shortcomings, Microsoft Clarity is a great complement to your existing analytics. It will help you understand your visitors better and optimise your website for the maximum conversion rate.
Why Should You Focus on UX/UI with Microsoft Clarity?
Good UX/UI is not just about nice design, but above all about how easily and quickly customers get to what they are looking for. Up to 88% of users will not return to a website after a bad experience, and every second of loading delay can mean lost customers. Microsoft Clarity lets you see where people hesitate, what confuses them and where they leave – giving you clear input for website improvements that directly increase the performance of your campaigns and your revenue.
Key arguments for focusing on UX/UI (and how Clarity helps):
- Better user experience = higher sales – websites with good UX can have many times higher conversion rates.
- Speed matters – up to 40% of people may leave a page if it takes longer than 3 seconds to load. Clarity helps you find out where users get stuck.
- Customer retention – up to 70% of online purchases may be abandoned because of an unnecessarily complicated process. Clarity shows where people drop off.
For Those Who Want to Learn Clarity Professionally, We Offer Training
If you want to get the most out of Clarity and turn the data into concrete website improvements, we also offer corporate training. We explain the most important features, go through real examples from your website and teach your team to identify the problems that have the biggest impact on the conversion rate.
Let’s Take a Closer Look at How It All Works
How to get Clarity up and running?
- After creating a new project, you will see a standard installation wizard, just as you are used to from GA4 and other tools. Depending on your situation, you can choose the option that suits you best: integrations with third-party systems (Shopify, WordPress and others), a classic code snippet inserted directly into the website, or NPM for developers.
- This setup is enough for more than 90% of cases, but you can add your own events and metrics (called “tags” in Clarity) for more detailed information.
- After setup, it takes about 2 hours before you see the data, but after that you can follow it in real time.
Where to find recordings and how to work with them?
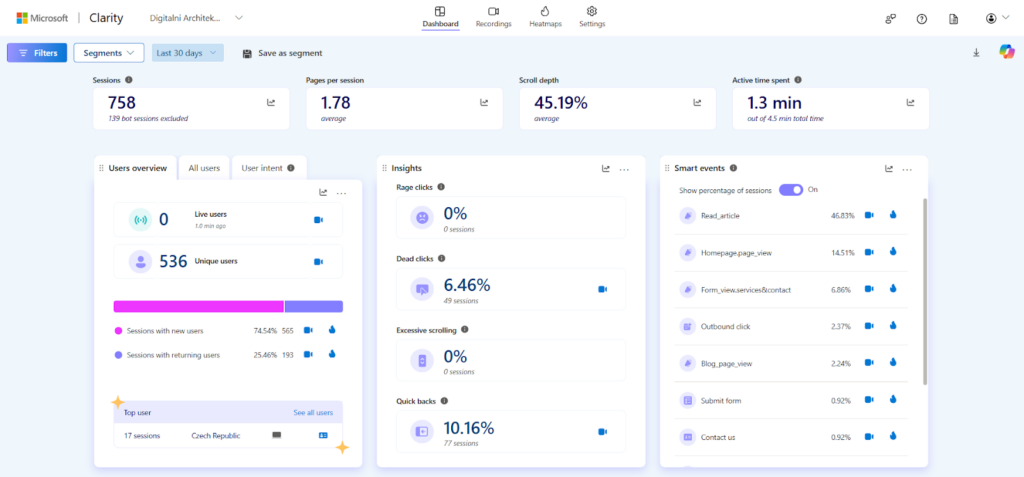
- Once the first data has been collected, you can dive into the Recordings section. On the left, you will find an overview of all recorded visitor interactions. Each recording is essentially a video that shows you exactly what the user did on which page – how they moved the mouse, where they clicked, what they read and where they got stuck, including the time spent and other information.
- The player has intuitive controls. You can speed up playback or skip idle moments, which saves you a lot of time during analysis. This lets you quickly discover so-called “rage clicks” (repeated clicking on the same spot), which often signal that something is not working as it should. This feature is invaluable for uncovering UX problems, which both marketers and developers will appreciate.
What are heatmaps and why should you care?
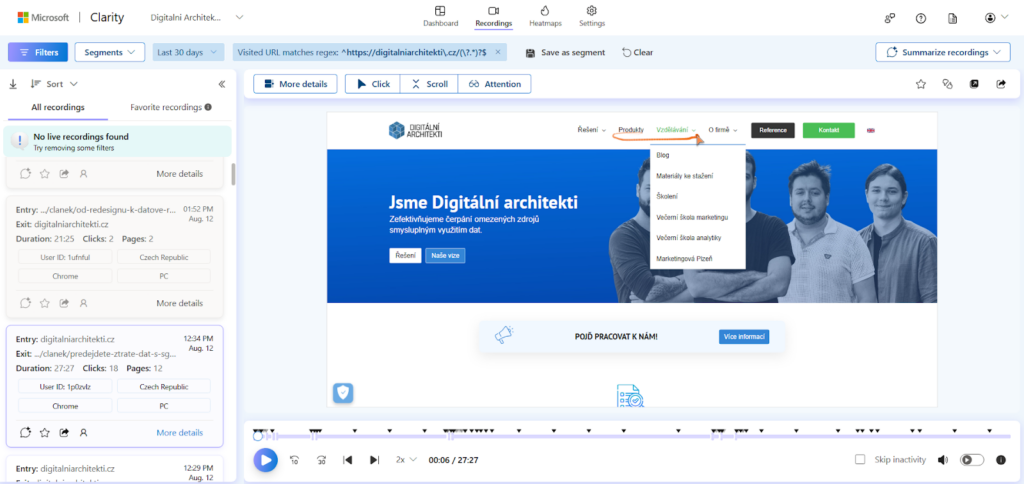
- Heatmaps are visual maps that show the areas of a page with the most interaction. Different colours indicate the intensity of interaction – from red (high activity) to blue (low activity). They help you quickly understand what users click on most and which parts of the page they ignore completely.
- You can focus on clicks on specific elements, but also on whole sections of the page.
- Besides clicks, you can also see scroll depth and average time spent.
- You can filter everything by device or click type and compare it with another segment (for example for A/B testing).
- This lets you optimise the placement of important CTA buttons, check whether the expected links work, or redesign ineffective parts of the website.
Filters and segmentation
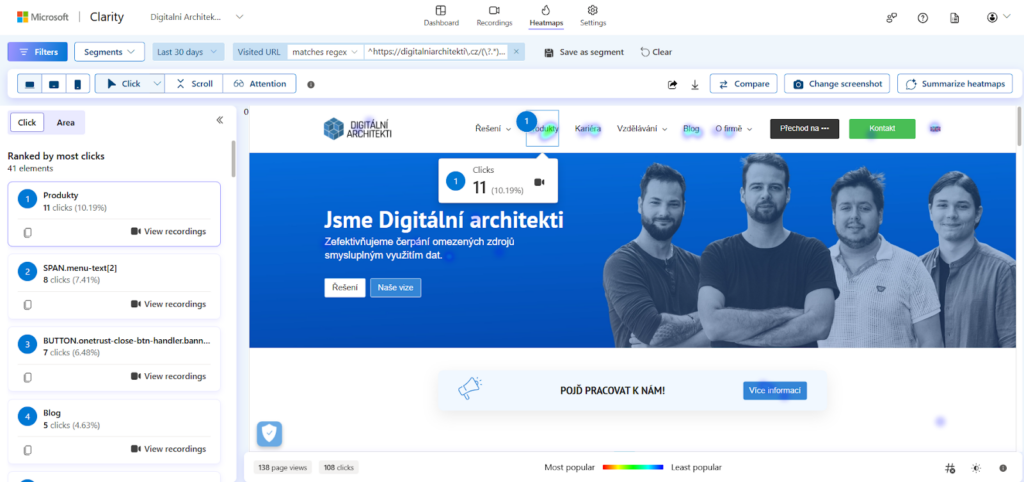
- One of Clarity’s strongest points is the ability to filter and segment data. Instead of going through thousands of random session recordings, you can use filters to target exactly what interests you. This saves you time. Basic filters include, for example:
- Specific pages on your website, device type, browser and operating system, country and traffic source
- For example, you can display only recordings from mobile users who visited a specific product page and had “rage clicks”. This makes your analysis incredibly efficient and targeted. Instead of assumptions and general data, you get precise and relevant information that you can use right away to optimise your website.
- For more advanced needs, you can send information about your own events and parameters, and even your own user identifiers. The only limit here is your imagination. For example, you can compare the purchase behaviour of logged-in and anonymous users.
Hotjar vs. Microsoft Clarity – Comparing the Benefits
Hotjar has been around for a number of years, so it has a head start on the market and is better known to the public. However, if we compare its price/performance ratio with Microsoft Clarity, we get an interesting comparison:
- Clarity is completely free with no limits on heatmaps or recordings, while Hotjar limits the features available for free
- Clarity has a smaller impact on page load speed compared to Hotjar
- Clarity also integrates JavaScript error detection and a connection to Google Analytics, which Hotjar does not offer without additional setup
- Hotjar offers more features, such as user feedback or advanced reports, but Clarity is a free visual tool with minimal technical complexity
Don’t wait until poor UX starts driving your customers away. With Microsoft Clarity, you can uncover the weak spots on your website today and turn them into opportunities for growth. Get clear data, increase conversions and use the full potential of your website.