
Investments in Christmas campaigns can easily swallow hundreds of thousands to millions of crowns. What if, once the season is over, it turns out that half the budget went into campaigns that brought almost no results? Without a clear overview of what works and what doesn’t, you are throwing money out of the window. In this article we will talk about how to keep not only Christmas campaigns under control.
Summary for Those Who Don’t Have Time to Read the Whole Article
- Looker Studio is a free tool from Google for creating clear visual reports from marketing data.
- You have all your data in one place (traffic, conversions, revenue), up to date and clearly laid out.
- A real-time overview lets you immediately stop a campaign that isn’t working and move the budget to where you will achieve better results.
- Looker Studio works in the browser, nothing needs to be installed and you can create a basic report yourself.
- Everyone on the team works with the same numbers.
Does it sound too complicated?
What Is Looker Studio and Why Use It for Campaigns?
Looker Studio (formerly known as Google Data Studio) is a Google tool for data visualisation and creating interactive reports. Its huge advantage is that it is completely free, all you need is a Google account. In Looker Studio you can connect diverse data sources and turn them into understandable charts and tables.
This sophisticated tool lets you transform data into interactive dashboards that help you make better decisions. What’s more, it displays data in real time. Whenever you open a correctly set up report, you see current numbers without delay.
You can find more detailed information here.
Why Monitor Christmas Campaigns in Looker Studio Specifically?
For most e-shops and companies, Christmas is the peak of the season. Revenue soars, ad investment grows and the situation changes every hour. In the morning one ad may be flying, in the afternoon another channel overtakes it.
Real-time reporting gives you the certainty that you will react to these changes in time. You will see, for example, that the Facebook campaign is running out of steam, but Google Ads brings twice the conversions. You can therefore immediately move the budget to where it will have a bigger effect. Without Looker Studio you might find this out only after the holidays, when it is too late to save anything.
Another advantage of using Looker Studio is unifying data across platforms. Every advertising platform uses different metrics and attribution windows. Looker Studio lets you get this data onto one screen.
How to Set Up Christmas Campaign Reporting in Looker Studio
Let’s go through the basic procedure for creating a clear report for your Christmas campaigns in Looker Studio.
1. Connect the Necessary Data Sources
First you need to connect Looker Studio to the data you want to track in the report:
- Google Analytics 4 – from GA4 you get data on website traffic, number of transactions, revenue, conversion rate and other metrics.
- Google Ads and META – by connecting them you get data on advertising costs, number of clicks, impressions and conversions.
- Other sources – Looker Studio can also connect many other platforms (Sklik, CRM systems and others).
TIP: Before you start creating a report, make sure that all your Christmas campaigns have measurement set up correctly. Every click from an ad should be tagged with UTM parameters in the URL. Only then does Google Analytics know which campaign a visitor came from, and Looker Studio can then show exactly which campaign brought how many visits and orders.
Read also: How to set up GA4 correctly for the Christmas season (before it’s too late)
2. Create a New Report and Choose Metrics
Once the data is connected, you can create a new report. For Christmas monitoring the following has proven its worth:
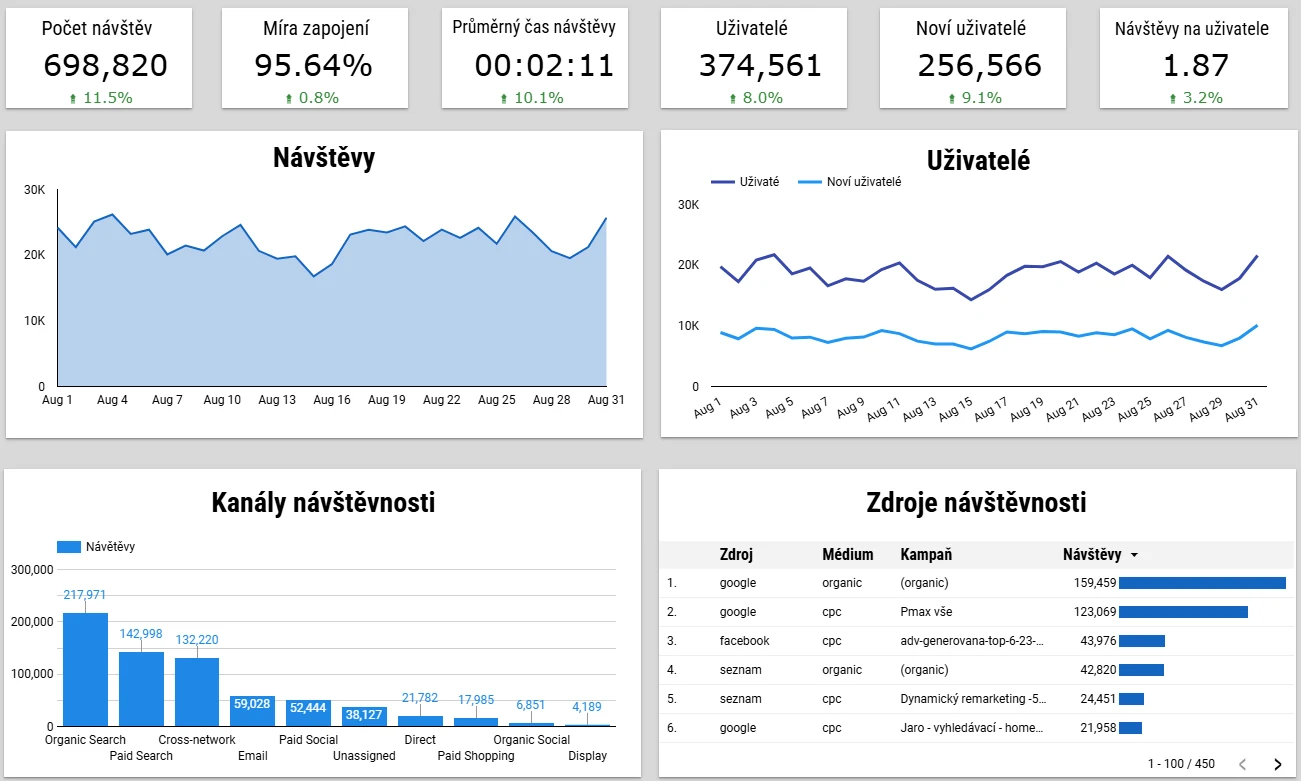
- Time series – a chart that shows the course of revenue or conversions day by day.
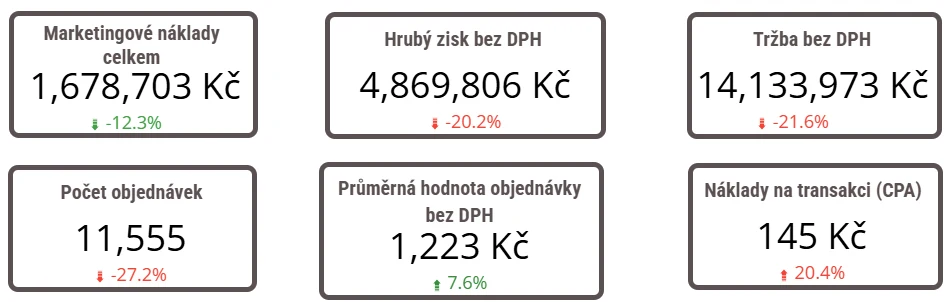
- Summary metrics – big numbers on the landing screen showing current total revenue, number of orders and average order value.
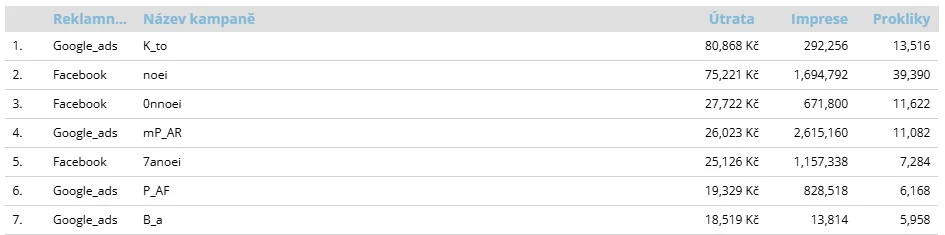
- Campaign table – an overview of individual campaigns and their main indicators (clicks, costs, revenue, conversions, ROAS).
- Channel distribution chart – a visualisation showing the share of individual sources in total revenue.
Rather start with a smaller number of metrics and charts – clarity is essential. Track only what will really help you in decision-making.
3. Set Up Filters and Comparisons
For the report to be really useful, add a few practical features to it:
- Date filters – Christmas campaigns usually run from November to December. Set up the option to choose a specific date or time period so that you see only the relevant data. You can switch, for example, between the current day, week or the whole month.
- Filter by campaign or channel – lets you select a specific campaign or channel for a closer look.
- Comparison with the previous period – it is best to compare results twice: with last Christmas and with the previous month. This way you find out whether you are doing better than last year, and at the same time you see whether sales in December are growing or falling compared with November.
4. Monitor Performance and React in Real Time
Once your dashboard is finished, regular work with the data begins. You should check the overview in Looker Studio ideally daily.
Thanks to current data you can make informed decisions literally from day to day. For example, you find that a certain ad works excellently on mobile but has miserable results on desktop – you can adjust the targeting. Or you see that one product suddenly started selling significantly more – perhaps it is worth supporting it with another campaign.
Do you need help with the setup?
Conclusion
Christmas campaigns are the most important period of the year for many companies, so you can’t afford to run your marketing blind. Correctly set up reporting in Looker Studio gives you the necessary overview and control. The difference between a campaign’s success and failure often lies not in the creative or the budget, but precisely in the ability to measure, analyse and optimise in real time.
Frequently Asked Questions
Is Looker Studio free?
Yes, Looker Studio is free. All you need is a Google account and you can start creating reports. Some advanced features may be paid.
What metrics should I track in a Christmas report?
For an e-shop the most important are total revenue, number of orders, average order value, number of visits from campaigns, conversion rate, advertising costs and ROAS (return on ad spend).
Do I need to be able to code to create a report in Looker Studio?
No, Looker Studio is user-friendly and you can create a basic report without coding. You log in to the web application, choose a data source and a few metrics, and the report is done. More advanced settings of course require deeper knowledge, but we can help you with that.
Sources
LookerStudioBible.com, n.d. Best practices to monitor your ads performances in Looker Studio. Available at: https://lookerstudiobible.com
Google Analytics Help, 2023. How real-time data works in Google Looker Studio. Google Support. Available at: https://support.google.com/looker-studio
Google Marketing Platform, 2024. Looker Studio – Data visualization and connectors. Google.com. Available at: https://marketingplatform.google.com